A Blue Norther
In the winter of 1843-44, an Englishwoman by the name of Matilda Charlotte Houstoun (pronounced “Haweston”) visited Galveston twice with her husband, a British cavalry officer. The Houstouns were making a tour of the Gulf of Mexico, with Captain Houstoun trying to drum up interest in an invention of his for preserving beef. During their second visit, the Houstouns made a trip to Houston and back the 111-ton steamer Dayton, Captain D. S. Kelsey. On the trip back, the little steamer was delayed for two nights at Morgan’s Point, at the head of Galveston Bay, because a “norther” had blown so much water from the bay that it was impossible for the boat to get over nearby Clopper’s Bar, until the water rose again. The passengers went ashore and occupied their time in various ways; Captain Houstoun managed to shoot a possum, which was a novel creature to him. It was an object of brief curiosity until other passengers, more familiar with the fauna of Texas, appropriated it for the cook with the assurance that the animal was “first rate eating.”
![]()
 Morgan’s Point and Clopper’s Bar, as shown on an 1856 U.S. Coast Survey chart of Galveston Bay. The soundings are in feet; any unusual reduction in the water level in the bay would make the bar impassible.
![]()
“Northers” were new phenomena to the Houstouns, too, and in her travelogue Matilda Charlotte Houstoun gave a fine description of one:

They most frequently occur after a few days of damp dull weather, and generally about once a fortnight. Their approach is known by a dark bank rising on the horizon, and gradually overspreading the heavens. The storm bursts forth with wonderful suddenness and tremendous violence and generally lasts forty-eight hours; the wind after that period veers round to the east and southward, and the storm gradually abates. During the continuance of a norther, the cold is intense, and the wind so penetrating, it is almost impossible to keep oneself warm.
![]()
We had a norther here last week, a weather front that blasted through the area on the night of Wednesday/Thursday, part of the same front that caused hideous and deadly dust storms on the South Plains in Lubbock earlier. Down here, over 500 miles away, it left an orange dusting on cars and houses. Driving down to Angleton in Brazoria County along the Gulf on Thursday afternoon, my vehicle was continually buffeted by 25- to 30 mph winds, and an occasional higher gust, at a right angle to the road, pushing the car to the left, toward oncoming lanes of traffic. Not real fun.
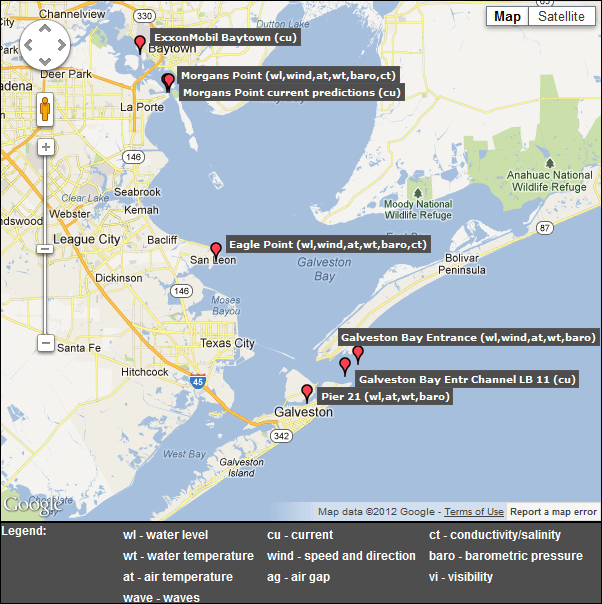
But the most interesting aspect of this is one experienced by the Houstouns and others aboard Dayton almost 170 years ago, the effect of this strong, steady wind on local water levels. Historical accounts of bad weather will often include phrases like “blew the water out of the bay,” or something similar, and that’s not much of an exaggeration. Late Thursday evening, almost 24 hours after the front went through, I collected some graphics of meteorological and hydrologic data from Houston/Galveston Bay PORTS, a reporting system built and maintained by NOAA to provide real-time updates of conditions for those in the maritime industry. The graphics are small and a little difficult to read, but they provide direct, measured documentation of the sort of event described by so many mariners and travelers over the years. The data presented here are drawn from three different locations: Morgan’s Point, where Mrs. Houstoun and Dayton were stranded for two days; Pier 21 at Galveston, at the site of what was then known as Central Wharf, the steamboat’s destination; and Galveston Bay Entrance, a buoy along the channel through which marine traffic enters and leaves all the ports in the region — Galveston, Texas City, Houston, Baytown, and so on:
![]()
![]()
Let’s look at the data in some detail:
![]()
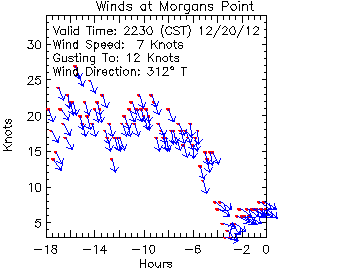 Wind speed at Morgan’s Point. This little chart shows the wind direction and speed for the period beginning about 4:30 a.m. on Thursday. The red dots show the sustained wind speed (scale on the y axis), while the blue arrows show its direction. For most of the period, right up until about 6 p.m., the wind blew steadily and consistently from the NNW at between 15 and 25 knots (17.3 to 28.8 mph), with gusts above that.
![]()
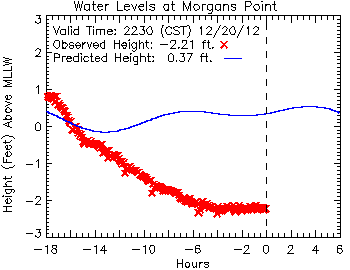
This chart shows the water levels at Morgan’s Point, from about 4:30 a.m. Thursday until late that evening. The narrow blue line represents the predicted height of the water at the tide gauge; it wavers a little bit based on the natural flow of the tide, which has a small normal range at that point. The red X marks are the actual, observed height of the water, which drops steadily with the wind over a period of about twelve hours, before leveling off and holding steady at more than two-and-a-half feet below the point known as “mean lower low water” (MLLW), the low-water standard that is used for navigational purposes. Note that the wind also wiped out almost any of the normal rise in the water level expected due to tidal action.
![]()
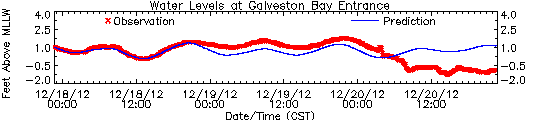
What about at the south end of Galveston Bay? Here’s the project vs. actual recorded water levels at Pier 21, along the Galveston wharf front:
![]()
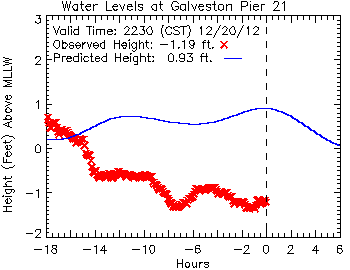 Here, closer to the Galveston Bay entrance, tidal action has more effect, but the water level remains more than two feet lower than predicted.
![]()
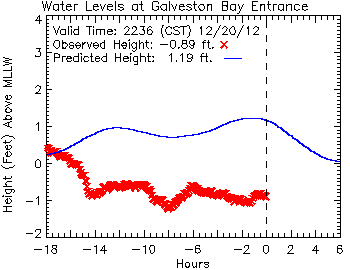
This chart, plotting data from a buoy at the entrance to the bay, reveals an almost identical profile to that from Pier 21. Here, again, eighteen hours after the passage of the front, the water remains more than two feet below its predicted level based on tides alone.
![]()
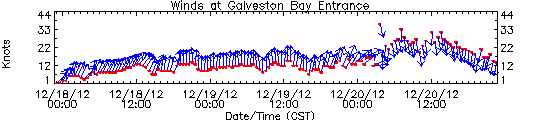
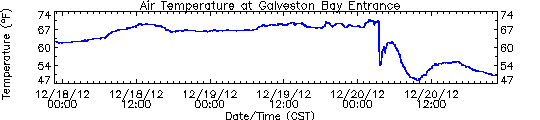
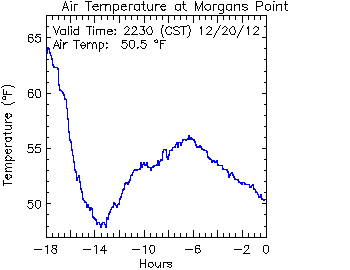
 These three charts show (top to bottom) wind speed and direction, air temperature and water levels at the entrance to Galveston Bay, for a 72-hour period ending about 10:30 p.m. on Thursday. Comparing these, it’s easy to see when the front passes in the early morning hours of Thursday, prompting dramatic changes in the wind, air temperature and water levels.
![]()
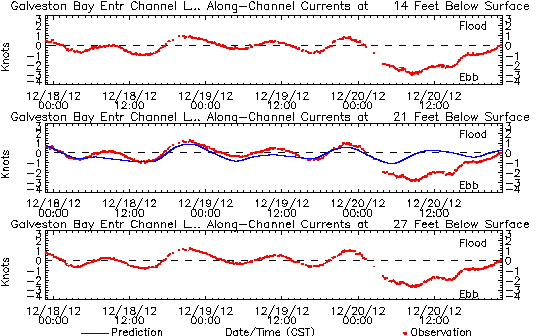 Finally, one last chart, showing the sub-surface currents at the entrance to Galveston Bay, at 14, 21 and 27 feet (4.3, 6.4 and 8.2 meters) below the surface. You can see the normal tide effect for the first 48 hours on this chart, as the current shifts between a flood tide (above the dashed line, water going into the bay), and an ebb tide (below the dashed line) as it flows out again. Although the wind only acts on the surface of the water directly, the momentum it generates there is carried through into much deeper water, dramatically altering flow of water so much that even at a depth of 27 feet, the normal tidal action is so completely erased that it results in a net ebb of the tide, a full eighteen hours of water emptying from Galveston Bay into the Gulf of Mexico.
![]()
How much water got “blown out of the bay” on this occasion? Some (very) rough estimates are possible. (Check my math, y’all.) If we take the difference between the predicted and observed water levels at the head of the bay (Morgan’s Point, -2.57 feet) and entrance to the bay (Galveston Bay Entrance, -2.08 feet), we can average between them a value of -2.33 feet. If we take that figure as representative of the water level of the bay as a whole (and that’s a big “if,” admittedly), then we can convert that vertical dimension into the volume of water it represents.
Galveston Bay encompasses about 600 square statute miles. One square mile is 27.88 million square feet; 600 square miles is 16.73 billion square feet. Multiply that by a depth of 2.33 feet, and you get a total volume of water of 38.98 billion cubic feet (1.1 billion cubic meters) of water.
That’s a lot of water; it would fill a cube-shaped aquarium 3,390 feet (1,033 meters), over a half-mile long, on each side. The water would weigh something on the order of 1.24 billion short tons, or 1.13 billion metric tonnes.
![]()
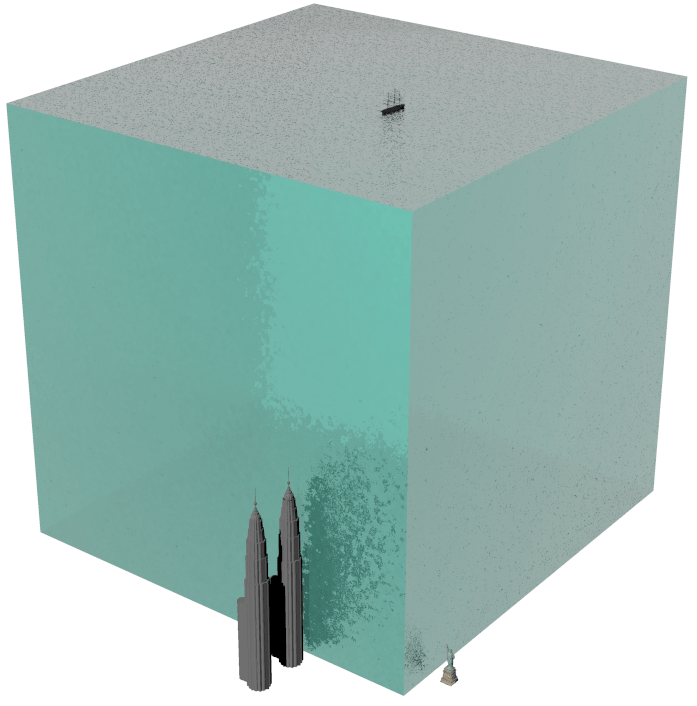 A 3,390-foot cube of seawater, approximating the volume of water blown out of Galveston Bay during the norther on December 20, 2012. Shown to scale are (top) a large, full-rigged sailing ship similar to Cutty Sark, (right) the statue of Liberty, and (left) the Petronas Towers in Malaysia, among the world’s tallest structures.
![]()
So much for the numbers. What does this mean in practical terms for navigation on Galveston Bay? Today, weather conditions like these still pose a problem, particularly the wind, which poses significant challenges for large vessels transiting the Houston Ship Channel. I suspect the problem is worse for down-bound vessels than up-bound, as the former are running with the wind and current, and are thus much more difficult to maneuver.
In the mid-19th century, the challenges of foul weather on the bay were substantially worse. The riverboats that ran between Galveston and Buffalo Bayou, Cedar Bayou, or the mouth of the Trinity River were very vulnerable, with their high superstructures and chimneys to catch the wind from any angle. (The little sternwheeler C. K. Hall, carrying a load of bricks out of Cedar Bayou, was sunk in just such a situation in 1871.) But the bigger problem then, before major dredging operations had established a deep and stable channel, was the depth of water over obstacles like Clopper’s Bar and Red Fish Bar, a nine-mile-long oyster reef curving in a gentle, east-west arc stretching completely across Galveston Bay, almost exactly halfway between Clopper’s Bar and Galveston Island. Red Fish Bar could, on occasion, cause significant damage to vessels, and at least one steamboat, Ellen P. Frankland, would be wrecked on the obstruction in the 1840s. Both Clopper’s Bar and Red Fish Bar could be crossed regularly by vessels drawing less than four feet, but this depth of water varied with the tide and weather.
![]()
 Red Fish Bar, as shown on an 1856 chart of Galveston Bay. Soundings are given in feet.
![]()
I doubt that most of us in this area paid too much attention to the weather Thursday, apart from the inconvenience of the sudden drop in temperature and the wind. But it’s good to keep in mind how dramatically similar events sometimes affected the day-to-day lives of people in the past, and how fortunate we are to be sometimes that much more removed from them.
_____________


Wow Andy what an analysis. If you not a tech writer you should be. Bummer did not get lost at first but did eventually. Great content include in your next post a subject that is simply enough for this old guy to comprehend.
Bummer
If you walk away astonished at how much water gets pushed out of the bay by the wind, my job here is done. 😉
Did you see the Yahoo news item concerning the effect of midwestern drought on water levels in the Missouri and Mississippi rivers, exposing hundreds of sunken steamboats in both rivers and revealing a 1,200 year old map etched on rock showing the location of indigenous settlements over a region extending through both Dakotas and most of Montana? Fascinating stuff!
If the Rio Grande hadn’t become the border with Mexico could Port Isabel have been developed enough to make Brownsville a deepwater port comparable to Houston?
I remember delivering the Houston Post before dawn in a snowstorm between Houston and Galveston in December of ’73. Anything that stuck had melted by the time the sun came up and my mother thought I was hallucinating when I told her about it. 40F in Houston feels as cold as 10F in Seattle mostly because of the wind, but humidity is also a factor.
Can’t reply worth a damn, on the cell phone, guess the keys are too small for the “old guys” fingers, can’t see, hear or talk anymore, so indulge the poor grammar.
Thanks,
Bummer
Your graphic showing the cube of water next to the Malaysian towers and the Statue of Liberty is in and of itself astounding. What a great way to illustrate the phenomenon.